
Getting started

How to use business reports

Read revenue, expense, and profit summaries by month, quarter, or custom range using invoiced or collected basis.

1 min readUpdated 10.07.2026

Business reports summarize how your organization is performing without exporting spreadsheets first. See how to view and manage invoices and how to record and review expenses to keep source data current.
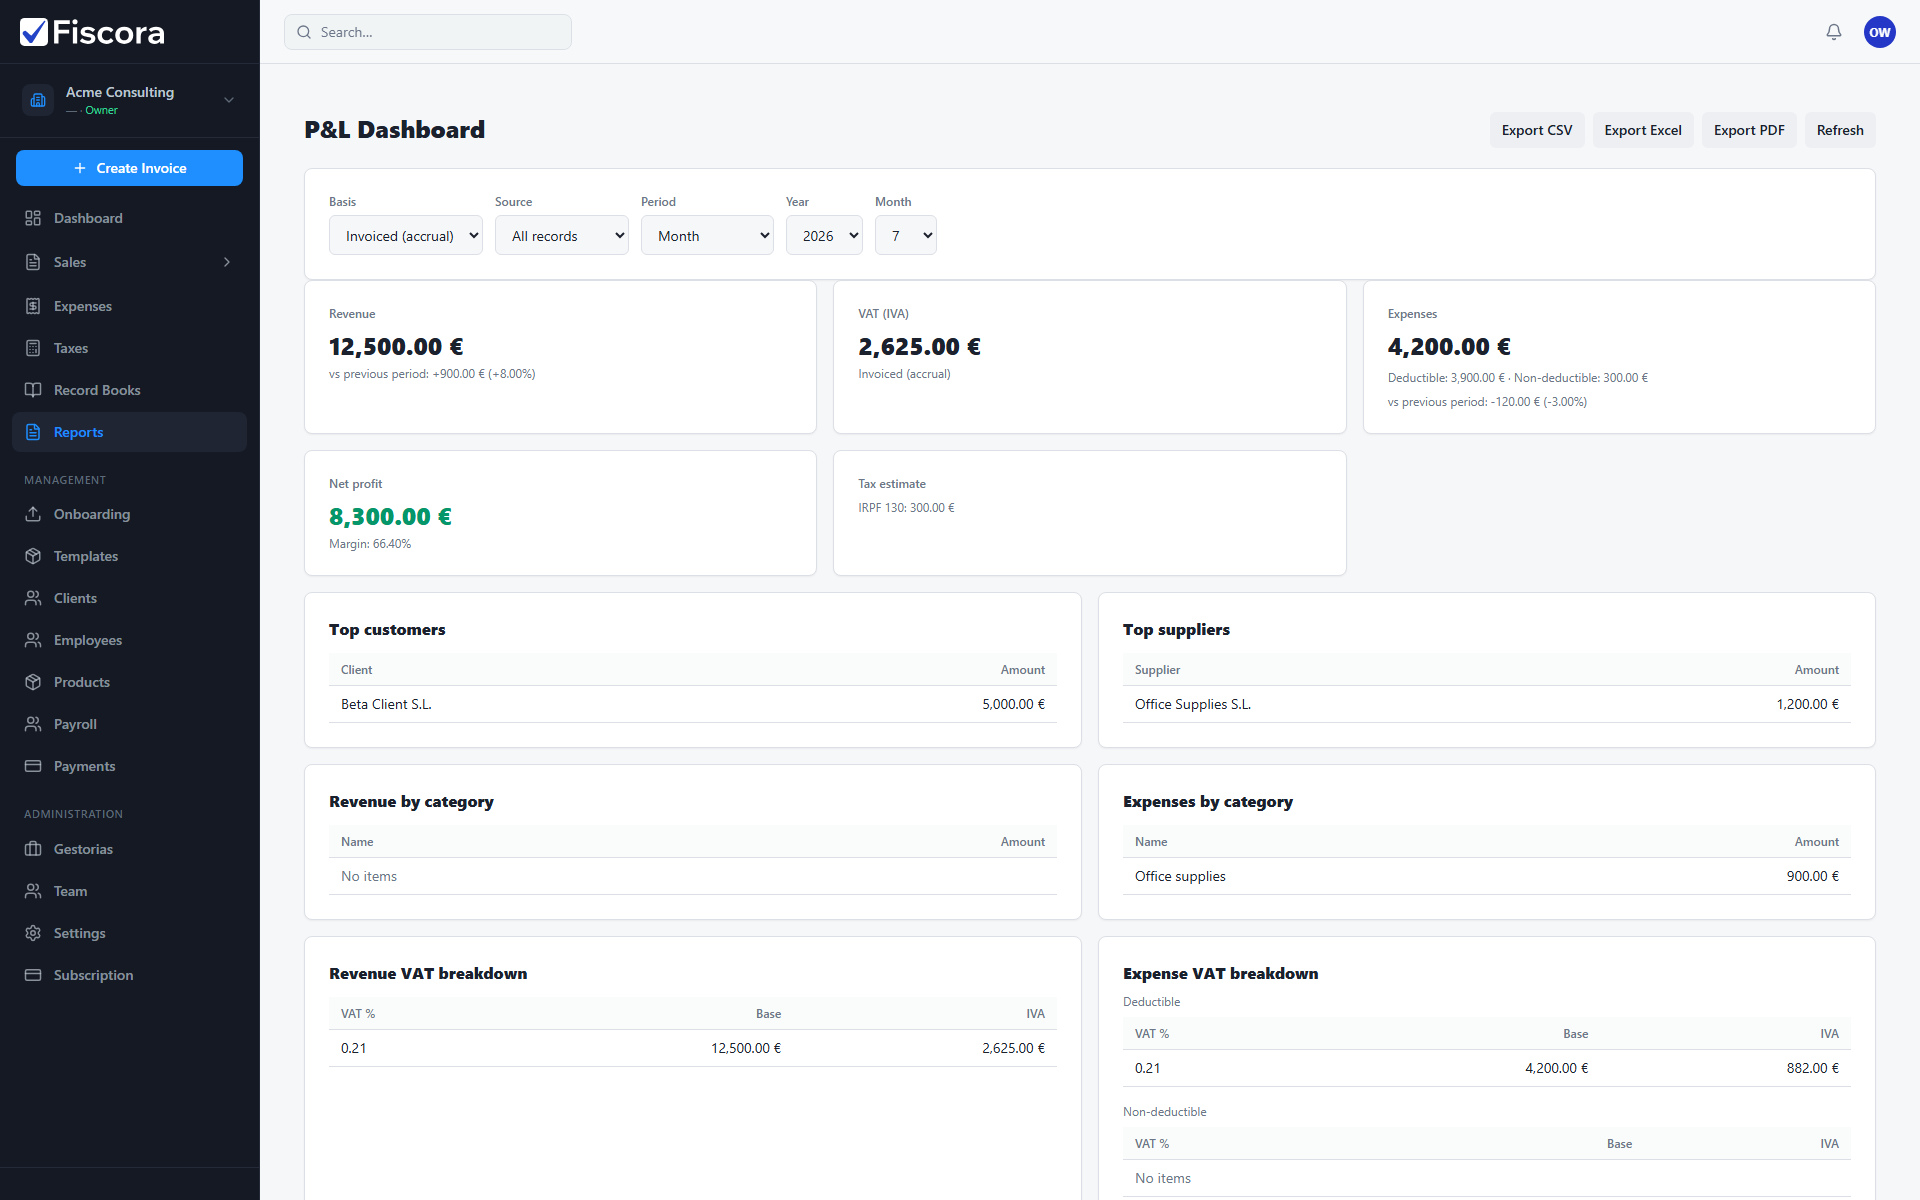
P&L Dashboard showing revenue and expense summary cards.

Open reports

  1. Select Reports in the left navigation.
  2. Choose the reporting basis: invoiced accrual or collected cash.
  3. Pick a period such as month, quarter, year, or a custom date range.

Read the summary

  1. Review Revenue totals and VAT breakdown for the selected period.
  2. Compare Expenses and deductible amounts against revenue.
  3. Check profit, margin, and trend cards to spot changes quickly.

Export when needed

  1. Use CSV, Excel, or PDF export when you need to share figures externally.
  2. Refresh the page after confirming new invoices or expenses so totals stay current.

Was this article helpful?

Still need help?

Share the context and we'll reply with practical guidance from support.

Open request

You may also find these useful

Getting started

Getting started with your workspace

Learn the first screens to check when you log in and where to find invoicing, clients, expenses, and settings.

Read article
Getting started

How to use the dashboard

Understand the summary cards, required actions, and recent activity so you can spot what needs attention quickly.

Read article
Getting started

How to set up your workspace on day one

Complete the essential setup steps so your company profile, clients, and invoice defaults are ready before you bill.

Read article